· Nikitha Sundaresha · Deep Dive ·2 min read
Median Good, Mean Bad
Every molecule behaves the same across the globe, be it China or the US, but genetics do not. The mean is a good statistic for natural science, but the median is a better statistic to describe life science.
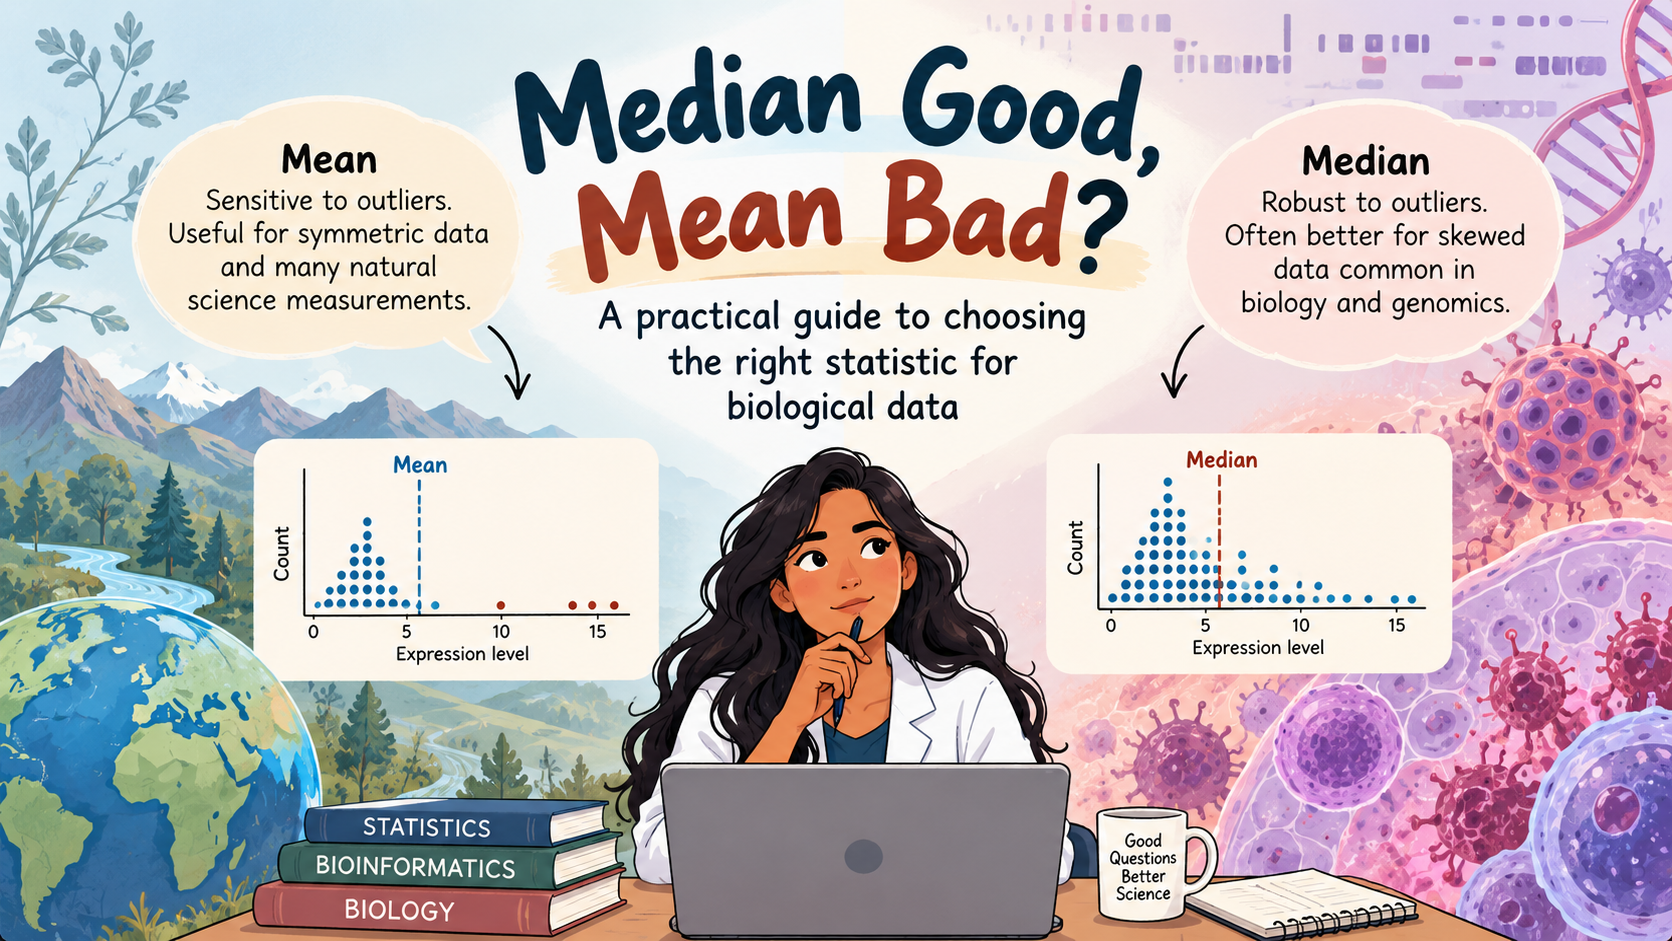
“Every molecule behaves the same across the globe, be it China or the US, but genetics do not. The mean is a good statistic for natural science, but the median is a better statistic to describe life science.”
A professor stated this opinion early in my PhD, before dissolving, understandably, into a rant about bioinformatics papers reporting means conventionally instead of the median. Until then, statistics eluded me. I knew the various methods to probe a dataset, but I never knew which statistic to present. This off-the-cuff remark launched my relationship with the philosophy of science and formed my working rule: “For biological data, the median is more representative of the data than the mean.”
The rule served me well while working with transcriptomic data on canine major histocompatibility complex class II (dog leukocyte antigen class II, DLA-II), in tumors and on human solid tumors. Due to the heterogeneity of cancer, patients with the same diagnosis or genetic backgrounds present highly variable phenotypes. Inconsistent data collection adds batch effects that normalization cannot fully resolve, and increasing the population does not fix this issue. The median and mean of a skewed distribution do not converge. The median always gave me a more representative picture of the data to draw conclusions.
Then, in one figure, I found that presenting the mean was a better statistic. This broke my rule. We suspected that certain alleles were enriched in cancer-prone breeds, so I needed to capture both how many dogs expressed an allele and how strongly. However, many dogs didn’t express a given allele at all, pushing the median to zero and erasing the differences I was looking for. The mean reflected both frequency and expression level, so it was the right statistic for that question.
The lesson wasn’t, “median good, mean bad.” It was that the statistic must match the question, and you must look at the data before choosing either.
In this series, I’ll apply that principle across the analysis pipeline: from p-values, normalization, and batch correction; feature selection and preprocessing for AI models; single-cell analysis, dimension reduction, and integration of multimodal datasets; and finally to reproducibility, where all the choices must align. I am not writing as an expert, but as someone still in training, sharing what I have learned so far.