· Samantha J. Klasfeld, Ph.D. · Tutorial ·6 min read · Original Source
Biobank Intro Series: UK Biobank Observational Data (Part I)
An ode to the UK Biobank Showcase
Consider this post a love letter to the UK Biobank Showcase.
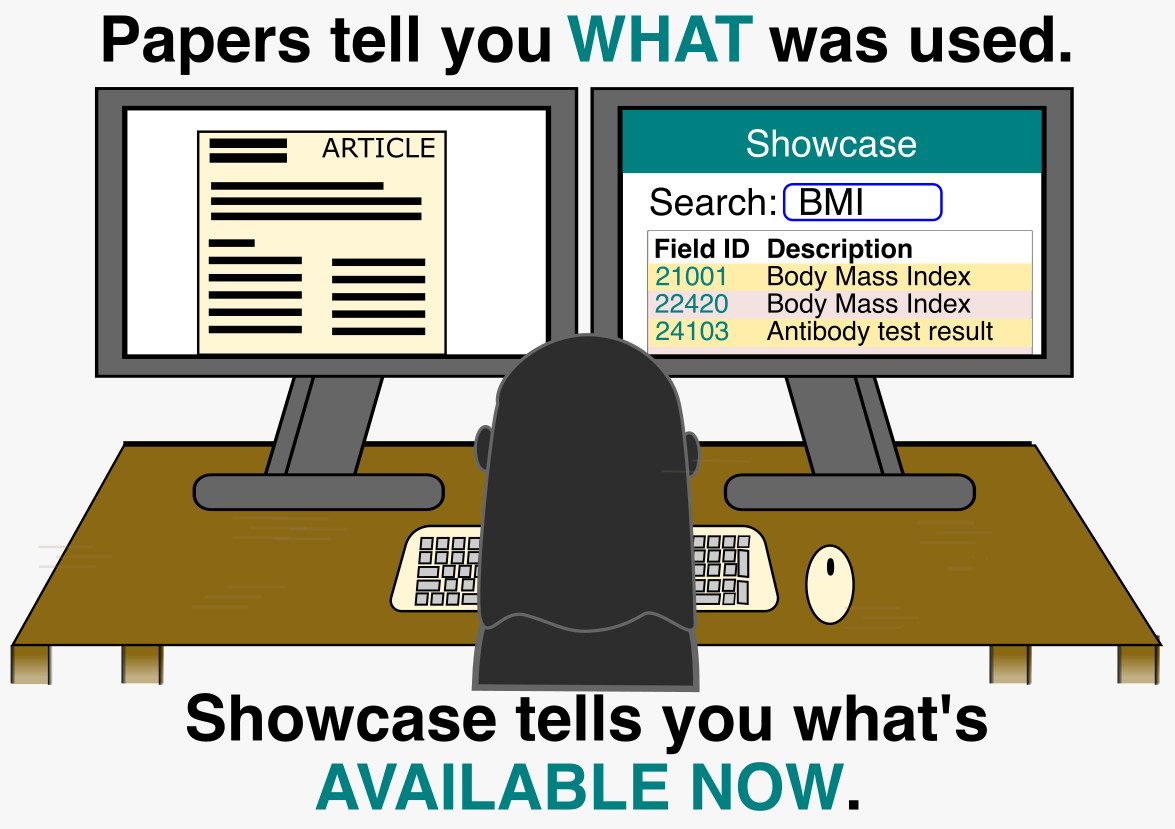
When I first started working with UK Biobank, I fell back on what I knew from graduate school. I dug through methods sections and supplemental materials to track down the features used in the study. It worked, but it was slow. Part of the problem is that papers rarely cite The UK Biobank Showcase directly. It is so foundational to the field that experienced researchers treat it as assumed knowledge. Coming from a different domain, I had no idea it existed. Once my manager pointed me to the Showcase, I discovered measurements beyond what had been published and no longer had to spend hours on detective work.
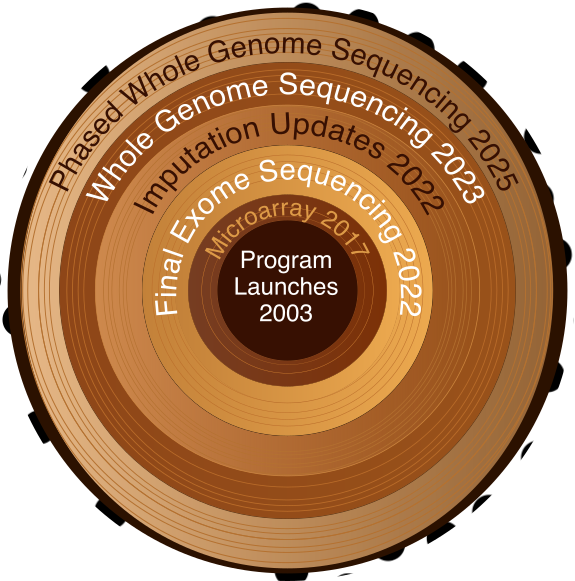
To understand why the showcase is so useful, it helps to know the scale of what UK Biobank actually contains. The UK Biobank as a resource spans clinical measurements, survey data, genomics, imaging, proteomics, metabolomics, and more. For a comprehensive overview of all available data types, see What types of data are available in UK Biobank? on the UK Biobank Community site. The Showcase is your tool for navigating all of it.
Reading Between the Data Fields: Arrays, Instances, and Codes
The Showcase doesn’t just catalog measurements. It lovingly documents the shape of the data itself. On the main page for each field, the Data tab provides key details about coding, instances, and array indices that will save you real headaches downstream.
Coding
Coding is how categorical responses are stored. Rather than storing “Yes” or “No”, many fields store numeric codes: 1 for “Yes”, 0 for “No”, and -3 for “Prefer not to answer”. The Showcase provides a data coding table for each such field. More on working with complex codes in the next post.
Instances
Instances are timepoints. For example, if a measurement reports using instancing type 2, it will report measurements collected at four visits:
instance
0: the initial assessmentinstance
1: the first repeat visitinstance
2: the imaging visitinstance
3: the first repeat imaging visit
For most phenotypes, Instance 0 has the largest sample size. If you need longitudinal data, expect much smaller numbers at later instances.
Arrays
Arrays are repeated measurements within a single visit. Diastolic and systolic blood pressure (4079, 4080), for example, are taken twice in one sitting. Each repeat is stored as a separate array index (0, 1). The Showcase tells you how many array values a field has so you can plan how to handle them.
The Data tab gives you the architecture of a field: how its values are structured, repeated, and encoded. What it does not tell you is whether those values are reliable, comparable, or the best available option for your phenotype. For that, you need the category-level context, and the Showcase delivers it.
Example: Not All Field IDs Are Created Equal
For example, searching “Left Ventricular Ejection Fraction” returns multiple relevant fields and three with the exact correct description (22420, 24103, and 31060). But which one should you use? This is where the Showcase becomes essential.
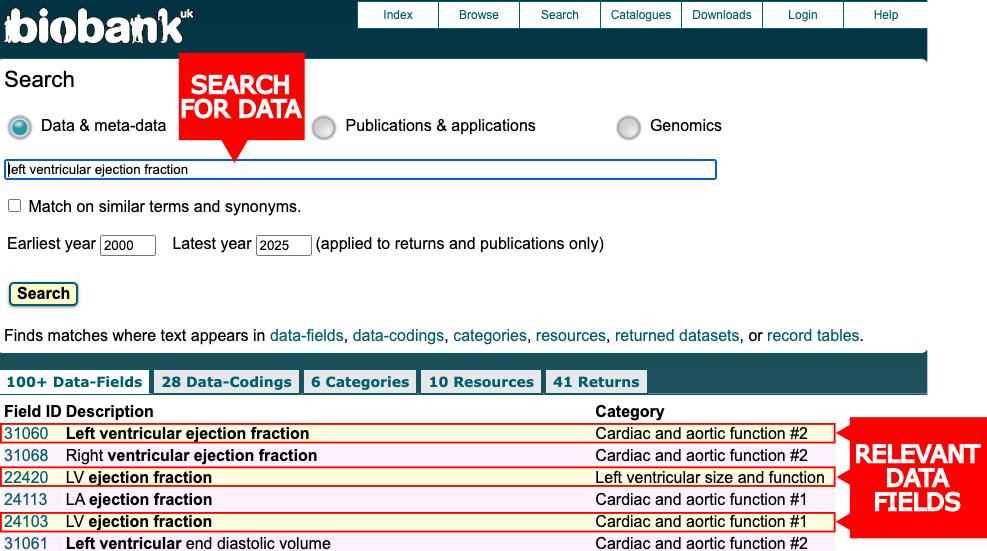
Notice the three highlighted fields measure the same thing but belong to different categories. Clicking into each field reveals why this matters:
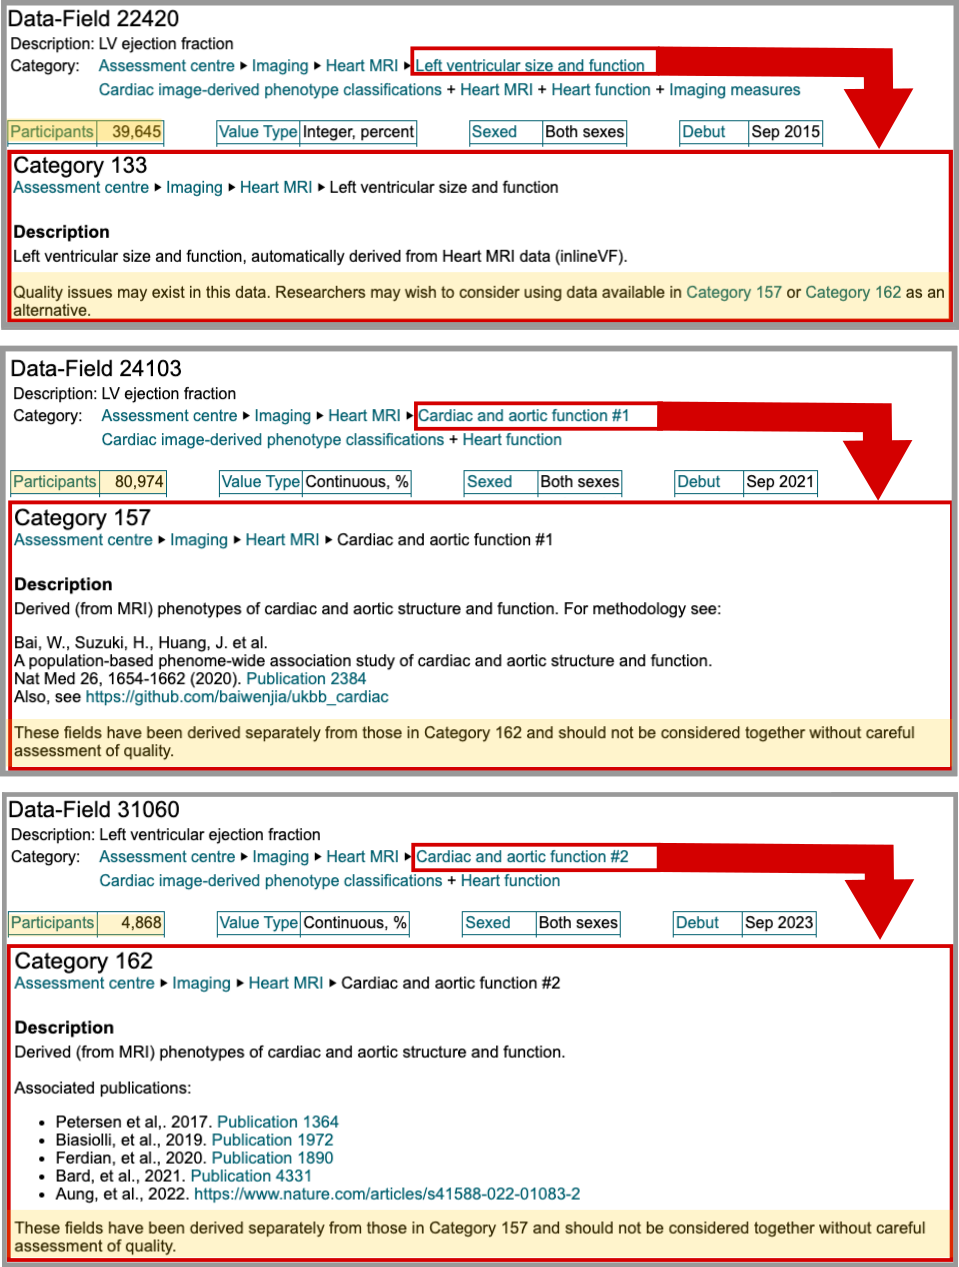
Field 22420 (category 133) has 39,649 measurements but includes a warning: “Quality issues may exist in this data. Researchers may wish to consider using data available in Category 157 or Category 162 as an alternative.” Field 24103 (category 157) contains 80,974 measurements and references a published methodology, but warns these fields “should not be considered together” with Category 162 without quality assessment. Field 31060 (category 162) has only 4,868 participants, fewer than the flagged field 22420.
For my cardiomyopathy work (Klasfeld et al 2025), I chose field 24103 for its sample size and data quality. However, other practical information provided by the showcase includes the date of which the data was reported (Debut) and the distribution of the data (shown in the data tab in the second section of the Field ID entry).
UK Biobank Showcase Tips
After working with the Showcase on multiple projects, I’ve developed a workflow that catches issues before they become problems. Here’s my list:
Before selecting a field:
- Always check the category warnings, not just the field description
- Look at the data distribution tab: Is it normally distributed? Heavy missingness? Homogeneous values? Sampling bias?
- Check the total participants to plan your sample size accordingly
For reproducibility:
- Note the debut date (when data became available)
- Record the version date (last import/update)
- Check stability rating (how data may change in future releases)
Watch out:
- Like any great love, the Showcase is not perfect. Sometimes a data field has the status set to “Not available”, meaning it is listed before release. If the release date is listed and it is not set in the future, reach out to UK Biobank support for clarification.
- Sometimes data that appears in the Showcase is missing from your RAP workspace entirely. This can happen if your project is running an outdated version of the UK Biobank data release.
- If you are the project admin, go to the
Settingspage of your dispensed project and clickCheck for Updatesin the UK Biobank section. - If you are not the admin or the update does not resolve it, reach out to the UK Biobank support team directly. Tell them upfront if you have already searched the community forums. They are genuinely helpful and worth contacting.
- If you are the project admin, go to the
The more time I spend with the Showcase, the more I appreciate what it actually is: not just a catalog, but a guide to making good decisions about your data. For features not covered here, Part III of the Showcase user guide (page 4) is worth bookmarking. In the next post, we’ll dive into actually loading this data for analysis.